

KPIs & Chart
What each Dashboard number counts, how the buckets add up, and how to read the comparison with the previous period.
The eight cards at the top of the Dashboard answer one question from a few angles: of the carts shoppers left behind, how much did you win back? This page defines each one exactly, so you know what you're looking at and why two numbers that look related sometimes don't line up.
Every figure counts the date range you've picked. A KPI (key performance indicator) is just one of these headline numbers.
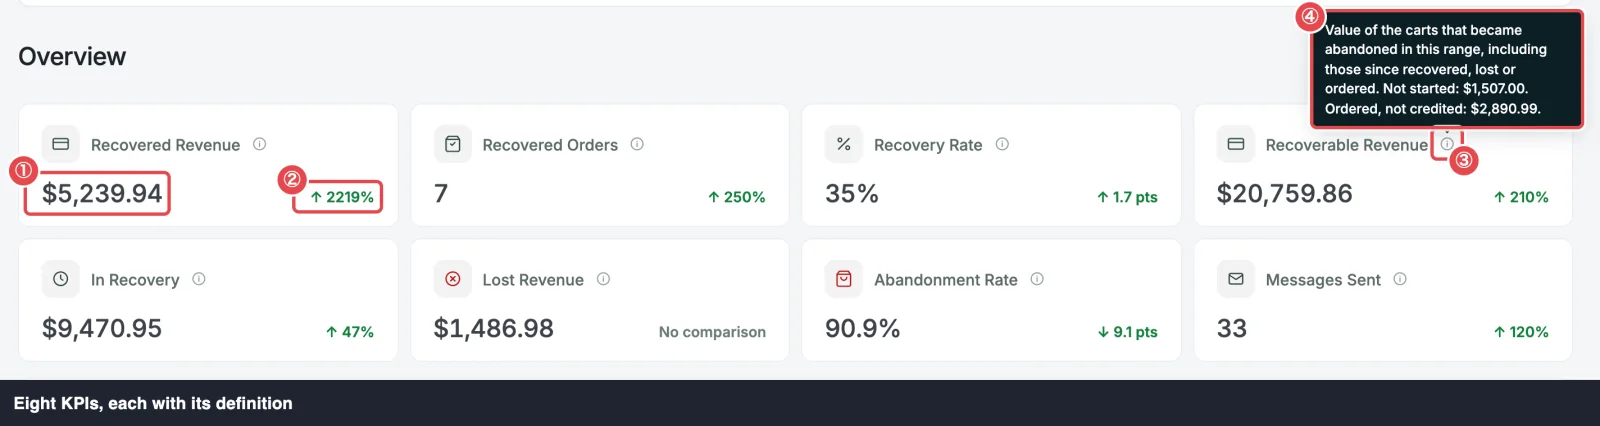 ① Value · ② Comparison · ③ ⓘ definition · ④ Tooltip with its breakdown
The eight KPIs
| KPI | What it counts, for the range | Counted by | Green when it goes |
|---|---|---|---|
| Recovered Revenue | The total of every recovered order, less partial refunds | When the sale was credited | Up |
| Recovered Orders | How many recovered orders there were | When the sale was credited | Up |
| Recovery Rate | Of the carts that became abandoned in the range, the share that's now Recovered, by count | When the cart was abandoned | Up |
| Recoverable Revenue | The value of every cart that became abandoned in the range | When the cart was abandoned | Up |
| In Recovery | The value of those carts whose recovery is still under way | When the cart was abandoned | Up |
| Lost Revenue | The value of those carts that are now Lost | When the cart was abandoned | Down |
| Abandonment Rate | Carts that became abandoned ÷ carts captured | Abandoned / captured in the range | Down |
| Messages Sent | Recovery emails sent. Test emails aren't counted, and neither are skipped or failed ones. | When the email was sent | Up |
A sale is credited when an order placed through a recovery link becomes paid. That's the moment it counts as recovered. Attribution & Audit explains the rule in full.
A cart is captured when ShapedRecover first saves it: the shopper has typed an email at checkout and kept the consent box ticked. See How Recovery Works.
When a figure can't be worked out, because there's nothing to divide by (no carts captured, say), the card shows —.
Two clocks: credit date and abandonment date
The table's "Counted by" column is the key to the whole Dashboard. The KPIs use two different clocks:
- Recovered Revenue and Recovered Orders count by credit date. A sale lands in the range when its order became paid, at the order's value. So a sale stays in the week it was paid, however long ago its cart was abandoned.
- Recoverable Revenue, In Recovery, Lost Revenue and Recovery Rate count by abandonment date. They look at the carts that first became abandoned in the range, and ask where each one stands now.
So one cart and its sale can fall in different ranges. Say a cart worth $50 is abandoned on 28 September and its $55 order through the recovery link is paid on 3 October:
| Range | Recoverable Revenue | Recovery Rate | Recovered Revenue | Recovered Orders |
|---|---|---|---|---|
| September | $50 | 100% (1 of 1) | $0 | 0 |
| October | $0 | — | $55 | 1 |
That's also why ShapedRecover never divides Recovered Revenue by Recoverable Revenue. They count different carts at different values, and the result would mean nothing. Recovery Rate is the ratio to watch.
Each cart counts once, at its first value
The abandonment-date figures use each cart's value at the moment it first became abandoned, and place it in the range of that first abandonment:
- A cart worth $94 is abandoned. The shopper comes back through an email with a 10% coupon and pays $84.60. Recoverable Revenue stays $94. Recovered Revenue is $84.60, the order's real value.
- A cart worth $100 is abandoned on 1 October. On 10 October the shopper comes back, adds an item and leaves again at $150. It counts once, in the range holding 1 October, at $100.
So a shopper's later activity never changes Recoverable Revenue for a past range. Carts only move between buckets inside it. A cart that's deleted does drop out: by you, by data retention, or by the shopper emptying their cart or unticking the consent box. See When a cart disappears.
Where every abandoned cart goes: the buckets
Every cart that first became abandoned in the range sits in exactly one bucket, based on its status right now:
| Bucket | The cart now is… |
|---|---|
| Not Started | Still open (Shopping or Recoverable) with no email ever scheduled and no order. Typically it's waiting for the first campaign, or no campaign is active. |
| In Recovery | Still open, and at least one recovery email has been scheduled for it, whether it was sent, skipped or failed. Also a cart whose order through the link is awaiting payment. |
| Recovered | Recovered: paid through the recovery link. |
| Lost | Lost: no order before the lost cutoff. |
| Ordered, not credited | Ordered: the shopper bought without the link, an order through the link failed or was cancelled before payment, or a recovered order was later fully refunded or cancelled. |
The five buckets always add up:
Not Started + In Recovery + Recovered + Lost + Ordered, not credited = Recoverable Revenue
That's true by value and by number of carts. When a cart changes status it moves from one bucket to another, but Recoverable Revenue doesn't change.
A few details worth knowing:
- In Recovery holds on until the end. A cart stays In Recovery from its first scheduled email until it's Recovered, Lost or Ordered. That includes after its last email has gone, after the shopper unsubscribes, and after an email is skipped or fails. It doesn't drop out of the numbers while it waits to be marked Lost.
- Back to Not Started. If the shopper returns and edits their cart before the first email goes out, the unsent emails are removed and the cart is Not Started again.
- Awaiting payment is an order placed through the recovery link that isn't paid yet, such as a bank transfer left on-hold. Its emails have stopped, but it isn't credited until it's paid.
Where you see each bucket on the Dashboard:
| Bucket | Where |
|---|---|
| Not Started | In the Recoverable Revenue tooltip |
| In Recovery | The In Recovery card (its tooltip shows how much is awaiting payment) |
| Recovered | As a count in the Recovery Rate tooltip ("3 of 20") |
| Lost | The Lost Revenue card |
| Ordered, not credited | In the Recoverable Revenue tooltip |
A worked example
In the range, five carts of $100 each became abandoned:
- One hasn't had an email yet → Not Started.
- One had its last email yesterday and isn't Lost yet → In Recovery.
- One has an order through the link, awaiting payment → In Recovery.
- One was paid through the link → Recovered.
- One shopper came back and bought without the link → Ordered, not credited.
The Dashboard shows Recoverable Revenue $500, In Recovery $200 ("including $100 awaiting payment"), Recovery Rate 20% ("1 of 5"), and the Recoverable tooltip shows Not started: $100 and Ordered, not credited: $100.
Recovery Rate
Recovery Rate = carts abandoned in the range that are now Recovered ÷ all carts abandoned in the range.
- It counts carts, not orders, so it can differ from Recovered Orders. In the September/October example above, September's rate is 100% while its Recovered Orders is 0.
- It can't go over 100%, because both sides are the same set of carts.
- It can change for a past range. Carts abandoned last month can still be recovered this week, or a recovered order can be refunded. When that happens, last month's rate moves. A full refund moves the cart to Ordered, not credited, so the rate goes down; Recoverable Revenue stays the same.
The Dashboard and the Recovered Sales report always show the same Recovered Revenue, Recovered Orders and Recovery Rate for the same range. They're calculated once, by the same code.
Abandonment Rate
Abandonment Rate = carts that first became abandoned in the range ÷ carts captured in the range.
Bear in mind what "captured" means: ShapedRecover only knows about shoppers who typed an email at checkout and kept consent. So this is the share of those checkouts that were left behind, not of every visitor to your shop. Down is good.
On a very short range like Today it can read oddly: a cart captured yesterday and abandoned this morning counts as abandoned today, but not as captured today.
Comparison with the previous period
Next to each value is its change against the previous period of the same length, the one that ends where your range starts:
| Your range | Compared with |
|---|---|
| Last 30 days | The 30 days before that |
| Last 7 days | The 7 days before that |
| This month (on the 29th) | The 29 days before the 1st |
| Today | Yesterday |
| A custom range | The same number of days just before it |
Ranges that include today run to the end of today, so their comparison covers full days. On Today you're comparing the day so far with all of yesterday.
How it's shown:
- Rates (Recovery Rate, Abandonment Rate) change in percentage points: ↑ 2.1 pts.
- Everything else changes in percent: ↑ 12%.
- Green when the change is good for your store, red when it isn't. For Lost Revenue and Abandonment Rate, down is good.
- No comparison when the previous period has no data to compare with.
Same-age comparison
In Recovery, Lost Revenue and Recovery Rate keep changing as a range's carts settle. A month-old cart has had time to be recovered or lost; a cart from yesterday hasn't. Comparing this month's fresh carts with last month's settled ones would always make this month look worse.
So for these three, the previous figure reads the previous period's carts as they stood one range length ago, when they were the same age as yours are now. A cart that closed after that moment counts as still open.
For example, with Last 30 days: a cart from the previous 30 days that was recovered 5 days after that period ended doesn't count as recovered in the comparison, because 30 days ago it wasn't yet.
The other KPIs compare as they are.
Tooltips
Hover or tab to the ⓘ next to a card's label to see how it's counted. Several tooltips include live figures:
| KPI | Tooltip says |
|---|---|
| Recovered Revenue | Sum of recovered orders, less partial refunds, credited in this range. |
| Recovered Orders | Orders credited to a recovery email in this range. |
| Recovery Rate | The two counts, "{recovered} of {abandoned}", that it counts carts so it can differ from Recovered Orders, and that it can change for past ranges. |
| Recoverable Revenue | That it includes carts since recovered, lost or ordered, with the Not started and Ordered, not credited values. |
| In Recovery | The carts whose recovery emails have started and that aren't yet recovered, lost or ordered, including how much is awaiting payment. |
| Lost Revenue | The value of carts now lost, and that it can change for past ranges. |
| Abandonment Rate | Carts that became abandoned ÷ carts captured, in this range. |
| Messages Sent | Recovery emails sent in this range. Test emails are not counted. |
The chart
Below the cards, the chart plots two lines across your range:
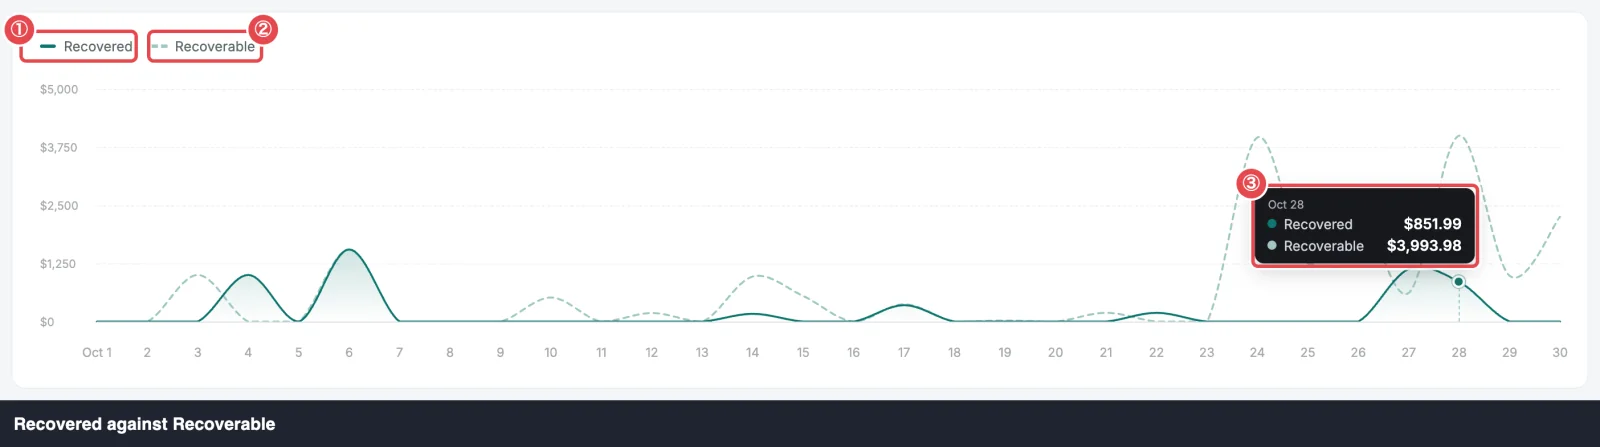 ① Recovered (solid) · ② Recoverable (dashed) · ③ Tooltip for the hovered day
- Recovered: a solid line over a shaded area. Recovered revenue by the day it was credited, the same money as Recovered Revenue.
- Recoverable: a dashed line. The value of the carts that first became abandoned that day, at that time, the same money as Recoverable Revenue.
Hover over any point to see the date and both values.
- Per day or per week. Ranges up to 60 days show one point per day. Longer ranges (Last 90 days, or a long custom range) show one point per week, starting from the range's first day, and the tooltip reads Week of Oct 7.
- Different carts, different days. A sale credited today may come from a cart abandoned last week, so the two lines don't track each other day for day. Read them as trends: is recovered revenue rising, and how big is the pool you're working from?
- Empty. When both lines are zero for the whole range, the chart says No recovered revenue in this range yet.
The Recovered Sales report shows the same chart.
All amounts are in your store's currency. ShapedRecover assumes one currency per store.
Where to go next
- Recovered Sales: the sales behind Recovered Revenue, one by one.
- Attribution & Audit: exactly when a sale is credited.
- Cart Statuses: the statuses the buckets are built from.
- Dashboard Overview: the banner, date range and layout.