

Recovered Sales
Every sale ShapedRecover won back in your date range, with the totals, the trend and the evidence for each one.
The Dashboard tells you how much recovery brought in. Recovered Sales shows you which orders, so you can check them one by one. Click Reports in the ShapedRecover menu and it opens straight away: it's the only report in this version.
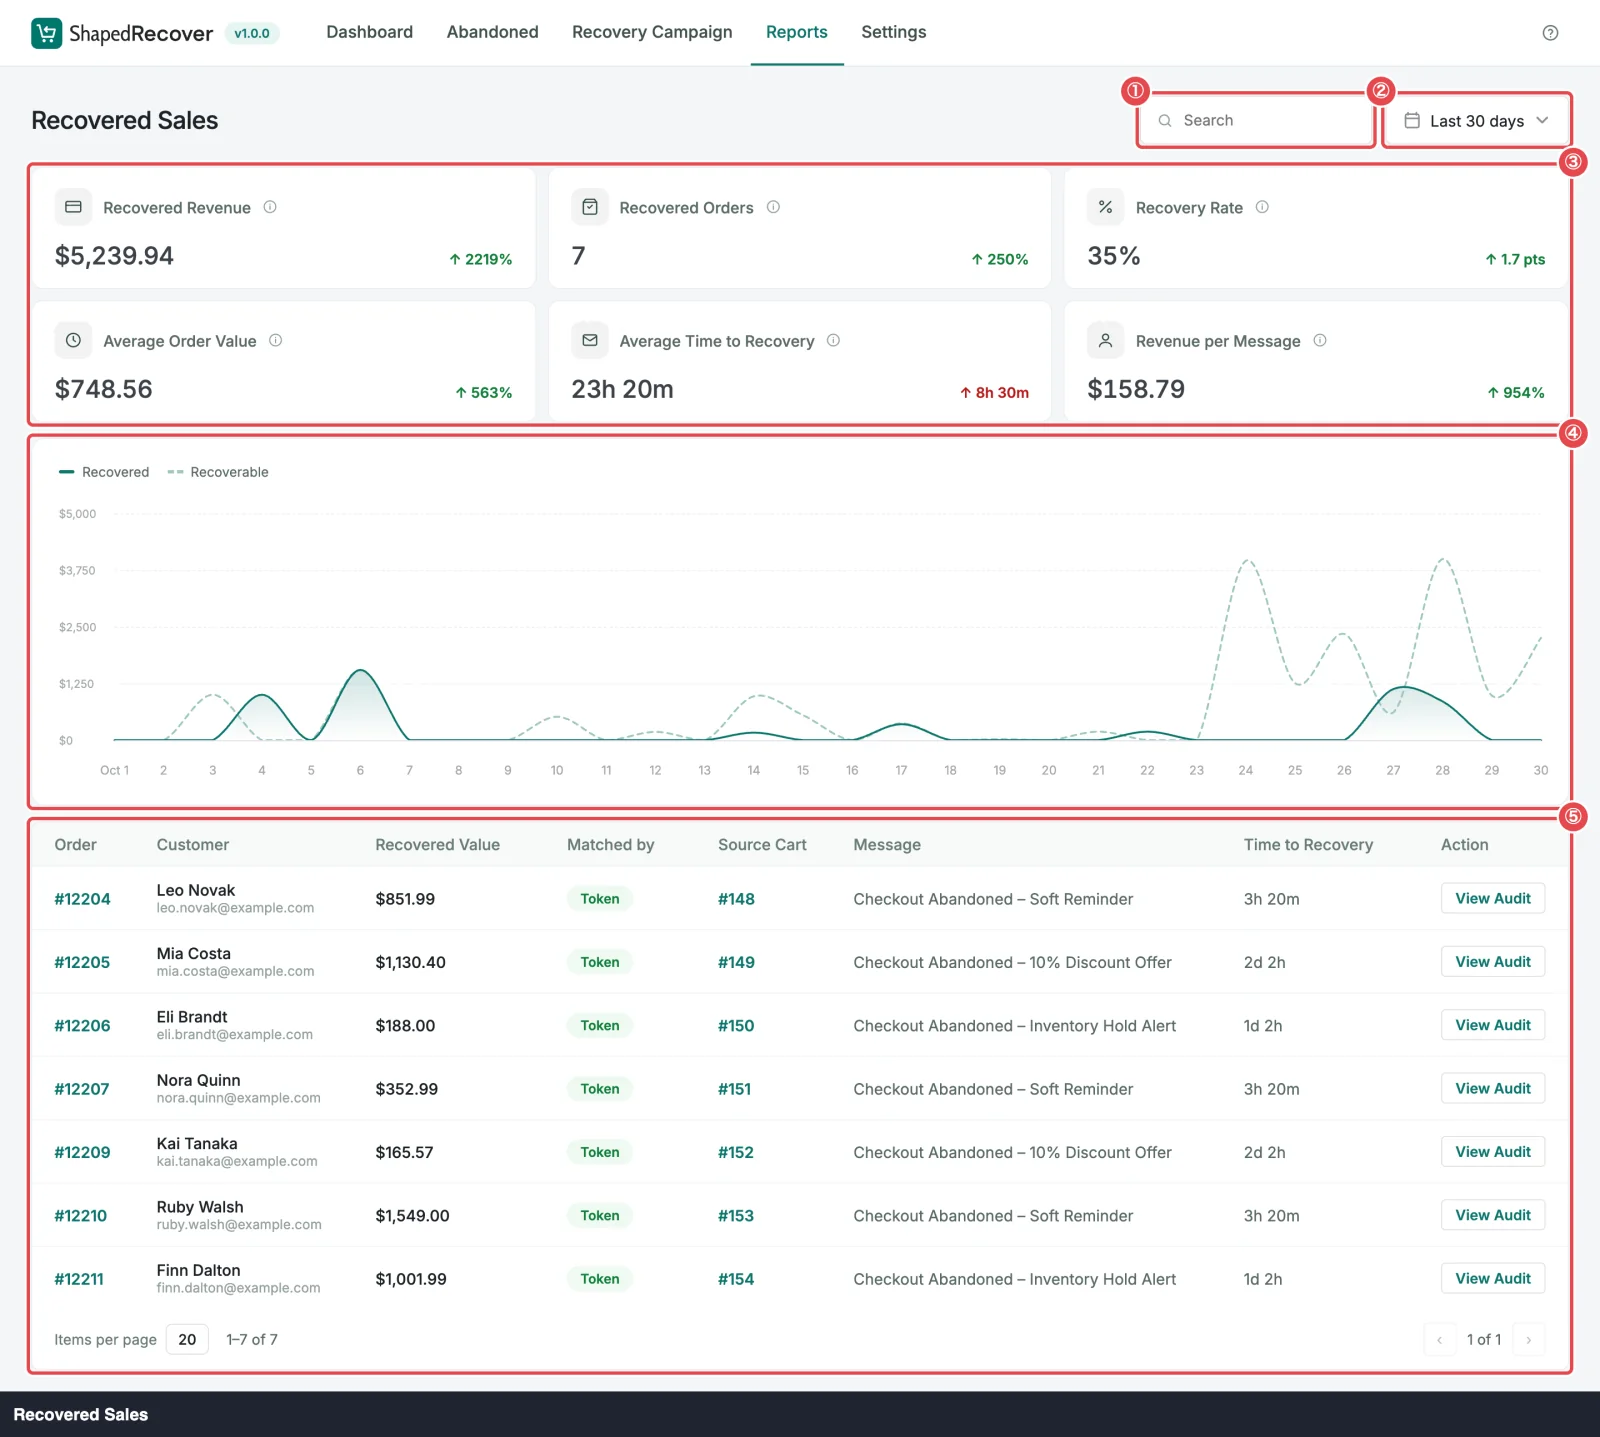 ① Search · ② Date range · ③ KPI cards · ④ Chart · ⑤ Sales table
What's a recovered sale?
A sale appears here only when ShapedRecover can prove it brought the shopper back: the order was placed through a recovery link, within 14 days of the email that carried it, and it's been paid. An order from the same email address without the link never counts.
That rule is the same everywhere in ShapedRecover, so this report always agrees with the Dashboard. Attribution & Audit explains it in full, and shows how to check any sale.
Which sales are in the range
A sale falls in your date range by when it was credited: the moment its order became paid.
So an order placed on the 30th of last month and paid by bank transfer on the 2nd of this month counts in This month.
The range is shared with the Dashboard and the Abandoned tab: change it here and they follow.
The KPIs
Six cards sit at the top, three per row on a wide screen. Each has an ⓘ tooltip with its definition.
| KPI | What it counts, for the range | Green when it goes |
|---|---|---|
| Recovered Revenue | The total of the credited orders, less partial refunds | Up |
| Recovered Orders | How many sales were credited | Up |
| Recovery Rate | Of the carts that became abandoned in the range, the share now Recovered, by count | Up |
| Average Order Value | Recovered Revenue ÷ Recovered Orders | Up |
| Average Time to Recovery | The average time from a cart being abandoned to its order being placed | Down |
| Revenue per Message | Recovered Revenue ÷ recovery emails sent in the range (tests not counted) | Up |
A few notes:
- Recovered Revenue, Recovered Orders and Recovery Rate are the Dashboard's own figures, worked out by the same code. For the same range they're always equal on both screens. Recovery Rate counts carts by when they were abandoned, not sales by when they were credited; KPIs & Chart explains why.
- Average Time to Recovery measures to the moment the shopper completed checkout, not the order's creation date. (WooCommerce's block checkout creates a draft order as soon as the checkout opens, often before the cart is even abandoned, so the creation date would be misleading.)
- Revenue per Message divides by every recovery email sent in the range, not only the ones that led to a sale. It's a rough "what's each email worth" figure.
- A card shows — when there's nothing to divide by, for example Average Order Value with no sales.
For example: the range holds two credited sales of $100 and $50; 10 carts became abandoned in it, 2 of which are now Recovered; and 30 recovery emails were sent. The cards read Recovered Revenue $150, Recovered Orders 2, Recovery Rate 20% (2 of 10), Average Order Value $75 and Revenue per Message $5.
Comparisons
Each card compares with the previous period of the same length, as on the Dashboard (how comparisons work):
- Recovery Rate changes in percentage points (↑ 2.1 pts).
- Average Time to Recovery changes in time (↓ 2h 5m), and down is good: shoppers are coming back sooner.
- Everything else changes in percent.
- No comparison when the previous period has no data.
The chart
The chart is the same one as on the Dashboard: Recovered revenue by the day it was credited (solid line), against the Recoverable value of carts abandoned that day (dashed). Hover a point to see both values. Ranges over 60 days show one point per week. See The chart.
The sales table
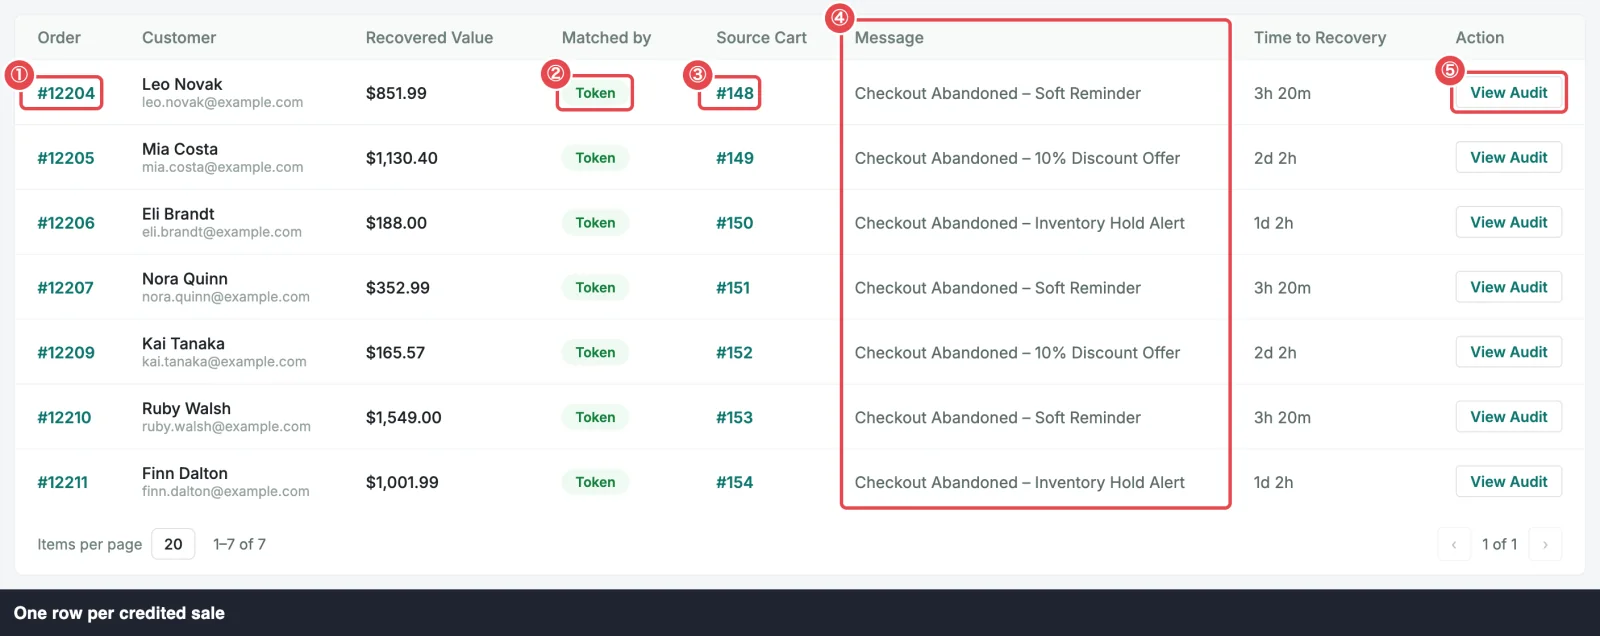 ① Order · ② Matched by · ③ Source Cart · ④ Message · ⑤ View Audit
Every credited sale in the range gets one row:
| Column | Shows |
|---|---|
| Order | The order number, e.g. #1030. Click it to open the order in WooCommerce. |
| Customer | The order's billing name, with the email address underneath (just the email if no name was given). |
| Recovered Value | The order's total, less any partial refund. |
| Matched by | How the order was tied to the email: Token, meaning the recovery link. |
| Source Cart | The abandoned cart it came from, e.g. #214. Click it to open the cart drawer. |
| Message | The campaign whose email link the shopper used. Deleted campaign if that campaign no longer exists. |
| Time to Recovery | From abandonment to the order, e.g. 3h 12m or 1d 2h. |
| Action | View Audit opens the sale's evidence. See the audit. |
Sorting. Click the Order, Customer, Recovered Value, Matched by or Time to Recovery header to sort by it (lowest or A first), and again to reverse. By default the newest credit is first.
Pages. The table shows 20 sales per page, with the real total and page controls underneath.
Search
The Search field at the top finds sales by order number, customer name or email. Part of a word is enough, and capitals don't matter: "zoe" finds Zoe Example's order, and "#1030" or "1030" finds order 1030.
Search filters the table only. The KPIs and chart keep describing the whole range, so you can look up one order without the totals jumping around. If nothing matches, the table says No recovered sales match this search.
Refunds and cancellations
ShapedRecover keeps the numbers honest when money goes back:
- A partial refund lowers the sale. A credited order of $100 refunded $30 shows a Recovered Value of $70, and Recovered Revenue counts $70. The change applies to the range the sale was credited in, not the date of the refund. That's different from WooCommerce's own reports, which record a refund on the day it happens.
- A full refund or cancellation removes the sale. It drops out of every recovered total, here and on the Dashboard, and its cart moves to Ordered. Recovery Rate for the range it was abandoned in goes down to match.
See Refunds and cancellations for the full rule.
Very old sales
Recovered sales are never deleted by your data cleanup: their carts are anonymised instead, so this report keeps every sale. But each email's send record is removed after your Send History period (180 days by default, in Settings → Data & Storage). For sales older than that, the Message column shows Deleted campaign, and Messages Sent and Revenue per Message for those old ranges count fewer emails. See Data & Storage.
When it's empty
If no sale was credited in the range, the KPIs show 0 or — and the table reads No recovered sales yet — recovered orders will appear here. The chart says No recovered revenue in this range yet. only when both of its lines are zero; if carts were abandoned in the range, it still draws the dashed Recoverable line.
New store? Make sure at least one campaign is active and give it a few days. Or see it work right now with Test the Recovery Flow.
Where to go next
- Attribution & Audit: why each sale is credited, and how to check it.
- KPIs & Chart: the Dashboard's view of the same numbers.
- Cart Drawer: the cart behind a sale.